|
|
You are here: Home
 Datasheet Datasheet |
|
Your selection: All Stations in North-South direction
|
|
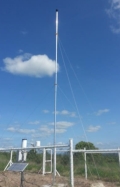
 PN Bicuar (Station ID: 0000361101) - Data sheet PN Bicuar (Station ID: 0000361101) - Data sheet
Current Data
PN Bicuar

21 Jan 2021 14:00 (UTC+1)
Please note: No Air temperature/Rain - diagram can be displayed for the selected month, because no temperature and rain data is available for the entire month.
Please note: No Air temperature/Rain - diagram can be displayed for the selected month, because no temperature and rain data is available for the entire month.
Please note: No Air temperature/Rain - diagram can be displayed for the selected month, because no temperature and rain data is available for the entire month.
Please note: No Air temperature/Rain - diagram can be displayed for the selected month, because no temperature and rain data is available for the entire month.
7.0 mm
Precipitation total
Please note: No Air temperature/Rain - diagram can be displayed for the selected month, because no temperature and rain data is available for the entire month.
Please note: No Air temperature/Rain - diagram can be displayed for the selected month, because no temperature and rain data is available for the entire month.
394.8 mm
Precipitation total
188.8 mm
Precipitation total
214.4 mm
Precipitation total
Monthly values(Data availability: 21 Mar 2015 - 21 Jan 2021)
7.0 mm
Precipitation total
162.3 mm
Precipitation total
0.0 mm
Precipitation total
1,039.4 mm
Precipitation total
650.0 mm
Precipitation total
882.8 mm
Precipitation total
436.6 mm
Precipitation total
|
|||||||||||||||||||||||||||||||||||||||||||||||||||||||||||||||||||||||||||||||||||||||||||||||||||||||||||||||||||||||||||||||||||||||||||||||||||||||||||||||||||||||||||||||||||||||||||||||||||||||||||||||||||||||||||||||||||||||||||||||||||||||||||||||||||||||||||||||||||||||||||||||||||||||||||||||||||||||||||||||||||||||||||||||||||||||||||||||||||||||||||||||||||||||||||||||||||||||||||||||||||||||||||||||||||||||||||||||||||||||||||||||||||||||||||||||||||||||||||||||||||||||||||||||||||||||||||||||||||||||||||||||||||||||||||||||||||||||||||||||||||||||||||||||||||||||||||||||||||||||||||||||||||||||||||||||||||||||||||||||||||||||||||||||||||||||||||||||||||||||||||||||||||||||||||||||||||||||||||||||||||||||||||||||||||||||||||||||||||||||||||||||||||||||||||||||||||


 Sioma Secondary School
 Okangwati
 Shakawe
 Alpha
Alpha


